Assess. Capture. Train. Track.
One platform. From the first assessment to the first game back.
Assess
From contraction to clinical insight in seconds
Capture directly, or upload torque-time curves from any dynamometer, for any joint and any action. ForceIQ finds contraction onset, locates the plateau, and computes validated metrics automatically. No manual processing.
- Automatic onset and plateau detection
- Peak torque, RTD (early + late), nRMSE, CV, Yank
- Automatic force-to-torque conversion and mass normalization
- RTD reliability flagging based on sample density
- Works with Bluetooth and CSV data
Live · scroll to zoom · toggle annotations
Capture
Real-time assessment, straight from the browser
Connect your Bluetooth dynamometer directly to ForceIQ via Web Bluetooth. See the live torque-time curve as the patient contracts, then get the full metric suite the moment they're done. No files to export, no cables to manage, no separate software.
- Web Bluetooth support in Chrome, Edge, and any Chromium browser
- Live torque-time curve visualization during contraction
- Automatic metric computation on session end
- Results flow directly into longitudinal tracking and reports
- Native streaming where the manufacturer publishes a protocol or grants written permission: Tindeq Progressor, FightTech
IsoForge
Turn isometric training into an arcade
IsoForge turns the live force signal into an arcade. Clinicians set a target from the patient's own assessment, and the games shape every hold, pulse, and explosive effort around it with real-time feedback, so training feels like play instead of a grind. An adaptive challenge keeps each patient in a productive success band, and every session tracks progress over time without cluttering the clinical metrics.
- Real gameplay driven by the live force signal
- Targets set from the patient's own assessment
- Four arcade games: Ember Drift, Forge Runner, Spark Pulse, Cinder Updraft
- Adaptive challenge that keeps each patient in a productive success band
- Progress tracked over time, kept separate from clinical assessment data
Hold force on a drifting target to steer the ember down the corridor. Trains smooth, sustained force control.
Track
Longitudinal tracking that tells the full story
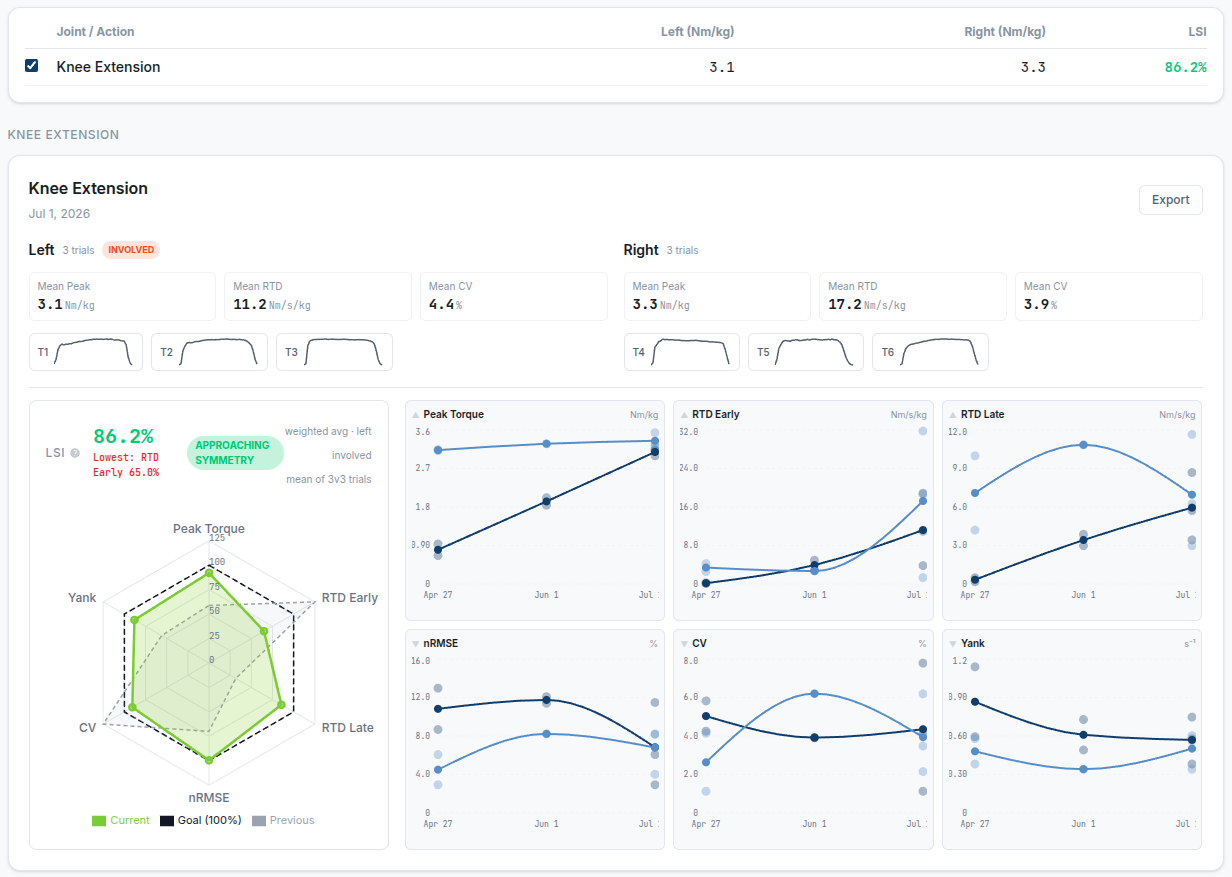
Every assessment builds on the last. Bilateral symmetry index, per-metric trend charts, and assessment history give you the complete picture, not just whether your patient hit a number today but whether they're actually recovering.
- Limb symmetry index with weighted radar visualization
- Per-metric longitudinal trend charts (involved vs. uninvolved)
- Assessment date editing and trial exclusion for data hygiene
- Automatic flagging of clinically meaningful changes
Return to Play
The full clinical picture behind every return-to-play call
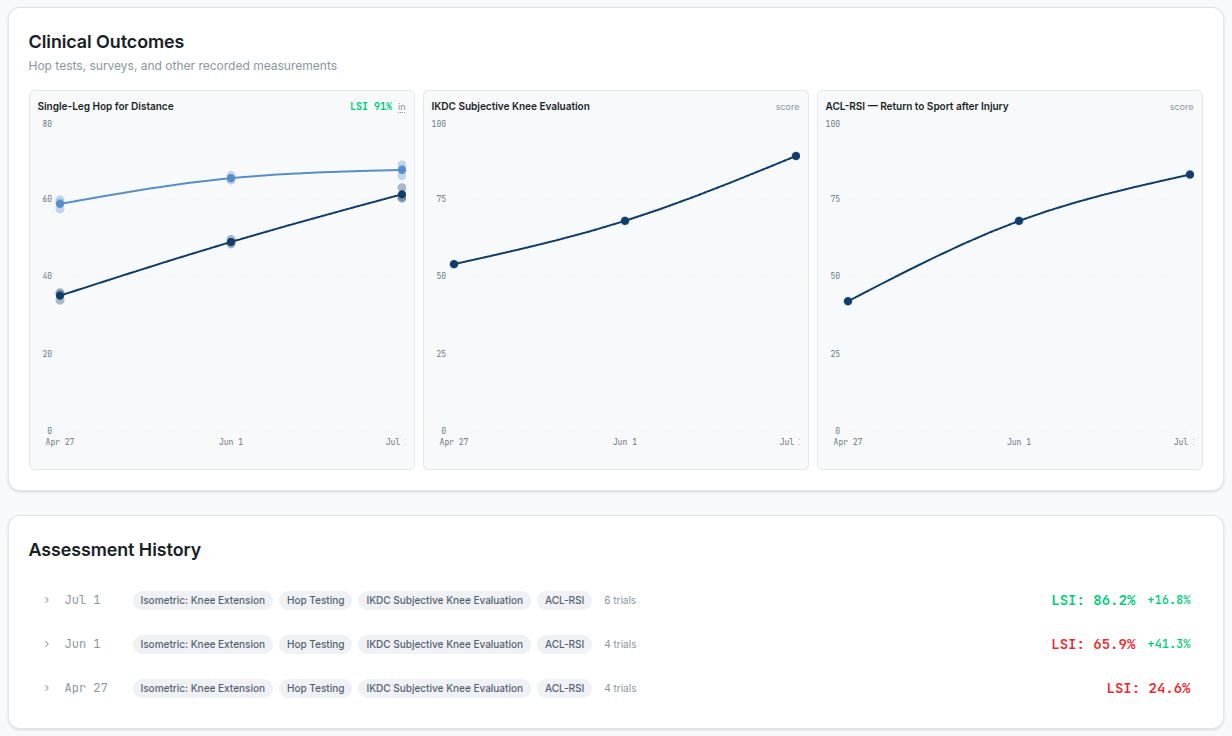
Isometric strength is one piece. ForceIQ also tracks hop tests, patient-reported outcome surveys (IKDC, KOOS, ACL-RSI, LEFS), range of motion, and any custom metric you define. It all feeds one longitudinal dashboard and bilateral symmetry score, so you have objective, consistently measured numbers to bring to the return-to-play conversation and share with the referring physician and care team.
- Built-in catalog: single-leg hop, triple hop, crossover hop, vertical hop
- Validated surveys: IKDC, KOOS, ACL-RSI, LEFS, Tampa Scale, and more
- Manual measurements: ROM, circumference, any numeric metric
- Bilateral metrics auto-compute limb symmetry index
- Define your own clinical KPIs with custom metrics
Report
Clinical reports your patients understand
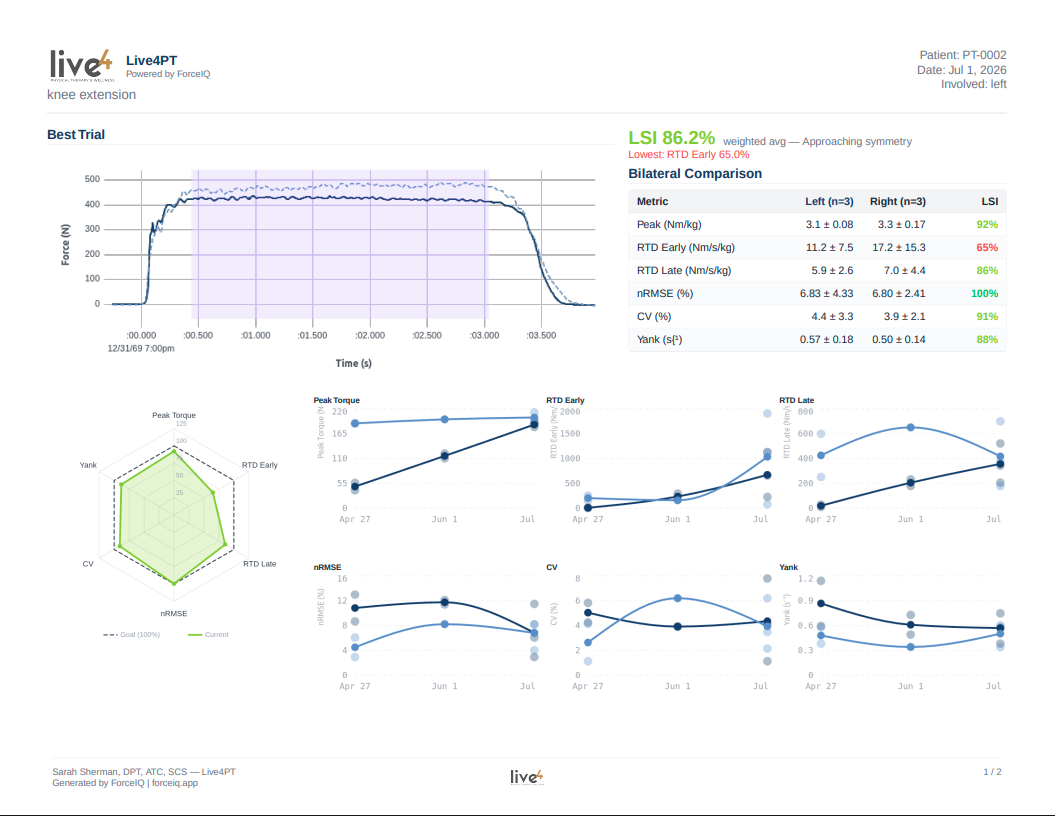
One-click PDF reports with torque-time curves, metric tables, bilateral comparison dashboards, and your clinic branding. Built for the patient conversation: clear enough for the patient, rigorous enough for the referral.
- Landscape PDF with toggleable sections
- Torque-time curves with annotated onset, plateau, and RTD windows
- LSI radar chart and metric trend dashboard
- CSV data export (wide and long format) for research use
- Clinic branding in header alongside ForceIQ mark
No vendor lock-in
Your data. Your equipment. Your platform.
Most force assessment platforms require proprietary hardware and lock your data inside their ecosystem. ForceIQ is the opposite: it works with the equipment you already own and gives you full access to your data. A clinic running a handheld gauge in one treatment room and an isokinetic system down the hall gets both on the same patient record, computed against the same metric definitions, with device-driven limits flagged per metric rather than buried.
Stream natively over Bluetooth
Upload from
Assessment and training run off the same connection. Pair once, move between Capture and IsoForge without re-pairing. No adapters, no middleware, no vendor tax.
Which dynamometer specs actually decide your metrics — the three properties that decide which metrics your hardware can support.